Data Analytics 2025 – Excel, SQL, Python + Power BI Training
Master the art of Data Analytics with Excel, SQL, Python, Power BI & Tableau. Learn data cleaning, visualization, dashboards, and real-world projects with industry-recognized certification.
Course Overview
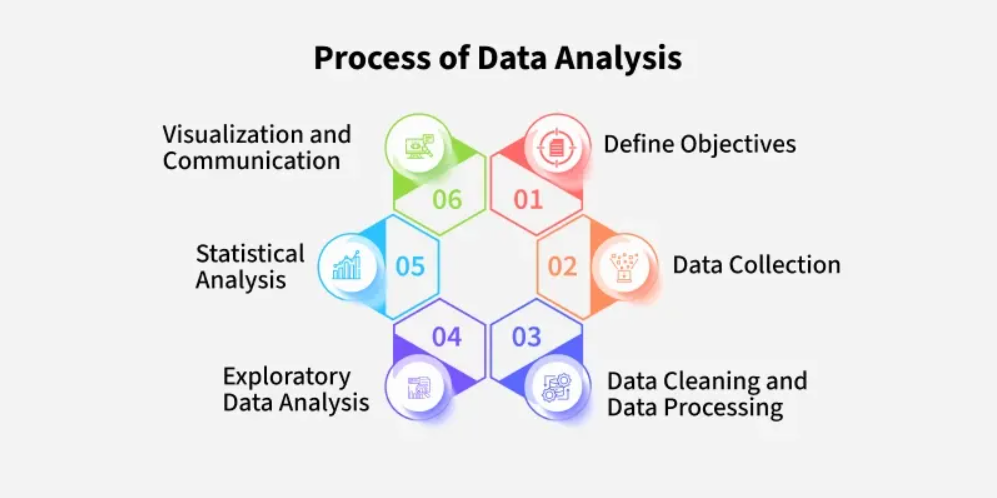
The Data Analytics Course at ICC Computer Centre, Dwarka Mor is designed for students and professionals who want to build strong skills in analyzing and interpreting data for decision-making. This program focuses on data collection, cleaning, visualization, and advanced analytics techniques using modern tools.
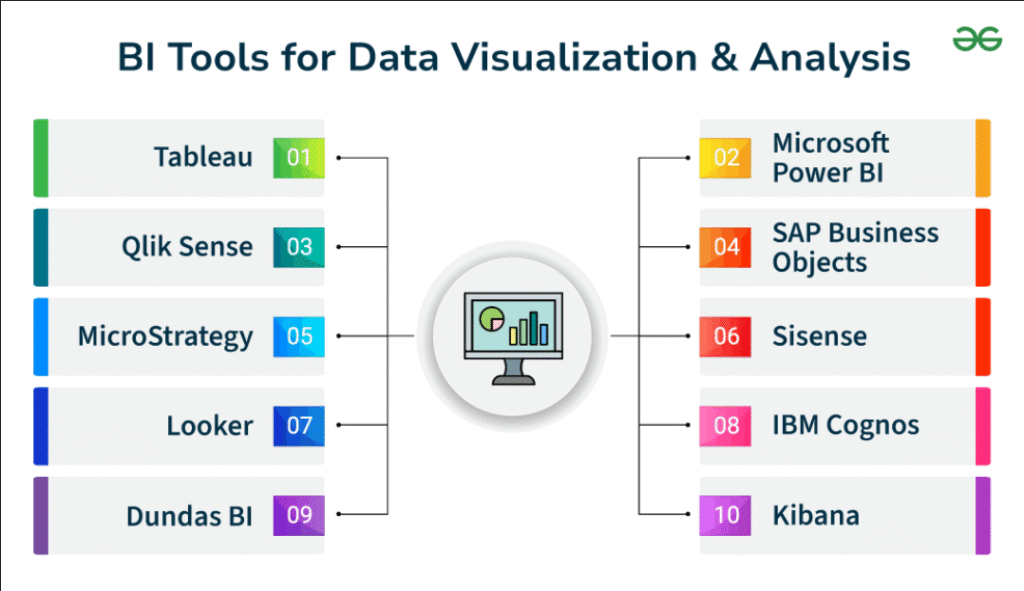
Students will learn MS Excel (Advanced), SQL, Python for Data Analysis, Power BI / Tableau, and basic statistics. The course combines theory and hands-on projects, making learners industry-ready.
At ICC Computer Centre, Dwarka Mor, our expert trainers provide practical exposure with real-life datasets, so students can confidently work on business, finance, marketing, and technology-related data problems.
Course Content
1. Introduction to Data Analytics
What is Data Analytics?
Importance of Data in Business
Types of Data (Structured, Unstructured, Semi-structured)
Data Analytics vs Data Science vs Business Intelligence
Applications of Data Analytics in Real Life
Key Skills Required for Data Analytics
Understanding Data Lifecycle
Challenges in Data Analytics
Data-driven Decision Making
Future Scope of Data Analytics
2. Excel for Data Analytics
Data Cleaning in Excel
Sorting & Filtering Data
Conditional Formatting for Insights
Using Text Functions (TRIM, CONCATENATE, LEFT, RIGHT)
Logical Functions (IF, AND, OR)
Lookup Functions (VLOOKUP, HLOOKUP, XLOOKUP)
Pivot Tables & Pivot Charts
What-If Analysis Tools
Creating Interactive Dashboards
Excel Shortcuts for Data Analysts
3. Advanced Excel & Power Query
Power Query Introduction
Data Import from Multiple Sources
Data Transformation Techniques
Merging & Appending Queries
Removing Duplicates & Null Values
Column Splitting & Merging
Creating Custom Columns
Grouping & Aggregating Data
Loading Data into Excel Sheets
Automation with Power Query
4. SQL for Data Analytics
Introduction to Databases
SQL Basics (DDL, DML, DQL)
SELECT Statement with WHERE, ORDER BY
Aggregate Functions (SUM, AVG, COUNT, MIN, MAX)
GROUP BY & HAVING Clauses
Joins (INNER, LEFT, RIGHT, FULL)
Subqueries & Nested Queries
Creating & Managing Tables
SQL Functions (String, Date, Numeric)
Writing Complex Queries for Analysis
5. Data Visualization with Power BI
Introduction to Power BI
Importing Data into Power BI
Data Cleaning in Power BI
Building Data Models
Creating Charts & Graphs
Using DAX Functions
Creating Measures & Calculated Columns
Designing Interactive Dashboards
Sharing Reports in Power BI Service
Power BI Best Practices
6. Data Visualization with Tableau
Introduction to Tableau Interface
Connecting to Different Data Sources
Dimensions & Measures Concept
Building Charts (Bar, Line, Pie, Scatter)
Calculated Fields in Tableau
Filters & Parameters
Dashboard Design in Tableau
Storytelling with Data
Publishing Dashboards Online
Tableau vs Power BI Comparison
7. Python for Data Analytics
Introduction to Python Programming
Python IDEs (Jupyter, VS Code)
Data Types & Variables
Loops & Conditional Statements
Functions & Modules
Working with Pandas Library
NumPy for Numerical Computations
Data Cleaning with Python
Data Visualization with Matplotlib & Seaborn
Python Projects for Data Analysis
8. Statistics for Data Analytics
Introduction to Statistics
Types of Data (Qualitative & Quantitative)
Measures of Central Tendency (Mean, Median, Mode)
Measures of Dispersion (Range, Variance, Standard Deviation)
Probability Basics
Normal Distribution & Skewness
Hypothesis Testing Basics
Correlation & Regression Analysis
Sampling Techniques
Statistical Tools in Excel/Python
9. Machine Learning Basics for Data Analytics
What is Machine Learning?
Supervised vs Unsupervised Learning
Linear Regression for Prediction
Logistic Regression for Classification
Clustering (K-Means Basics)
Decision Trees Concept
Feature Selection & Importance
Model Training & Testing Basics
Evaluation Metrics (Accuracy, Precision, Recall)
Real-world Use Cases of ML in Data Analytics
10. Projects & Case Studies
Sales Data Analysis in Excel
HR Employee Data Analytics
E-commerce Customer Analysis
Financial Data Dashboard in Power BI
Healthcare Data Case Study
SQL-based Data Query Project
Marketing Campaign Data Analysis
Tableau Dashboard for Business Insights
Python Data Cleaning & Visualization Project
Final Capstone Project with Presentation
Why Choose ICC Computer Centre, Dwarka Mor?
Experienced & certified trainers
100% practical training on latest Data Analytics
Small batches for personal attention
Free study material & practice exercises
Flexible timings (Morning/Evening/Weekend)
Location advantage: Just 2 min walk from Dwarka Mor Metro Station
Who Can Join This Course?
Students from IT, commerce, and management backgrounds
Job seekers aiming for roles in data-driven industries
Professionals looking to upgrade to data analytics & business intelligence
Entrepreneurs who want to make better decisions using data
Course Duration & Mode of Learning
- Duration: 6 months (can be customized)
- Mode: Classroom training at Dwarka Mor + Online classes available
- Flexible batch timings (morning/evening/weekend)
Career Opportunities After the Course
Data Analyst – analyzing datasets to find insights and trends
Business Analyst – bridging business needs with data-driven solutions
Financial/Data Consultant – handling finance, accounts & market data
Marketing Analyst – studying customer behavior & campaign performance
Operations Analyst – optimizing processes through data insights
SQL/Database Analyst – managing and querying large databases
Data Visualization Specialist – building dashboards & reports (Power BI/Tableau)
Junior Data Scientist – applying machine learning & predictive models
MIS Executive / Reporting Analyst – managing reports for business decisions
Freelance Data Analyst – providing data services to startups & businesses
FAQs (Frequently Asked Questions)
1. Do I need programming knowledge before joining?
👉 No, basic computer knowledge is enough. Python and SQL will be taught from scratch.
2. What career opportunities are available after this course?
👉 You can work as a Data Analyst, Business Analyst, MIS Executive, SQL Analyst, Reporting Specialist, or Junior Data Scientist.
3. What is the difference between Data Analytics and Data Science?
👉 Data Analytics focuses on analyzing and interpreting existing data, while Data Science includes advanced techniques like Machine Learning & AI.
4. Will this course help me if I am from a non-technical background?
👉 Yes, many commerce, management, and arts students successfully learn Data Analytics and get good jobs.